Light Blue’s List View & Custom Reports
In this short series of articles, we’ve been covering how to make the most out of the information that you’ve already entered into Light Blue. We’ve previously looked at different ways of finding useful information that’s already in Light Blue, both with Quick Queries and creating your own more specific searches using the Query Dialog.
That data is really useful and can tell you a lot about how your business is doing. In this article we’ll explore how we can step back and look at the bigger picture using List View.
More than just a list of records
When you view the results of a query, you can see all the records that fall into that found set in either Detail View (the default), or List View. List View is a really good way of seeing a big group of records all at once, and the totals and averages that it provides are great for quickly understanding your data.
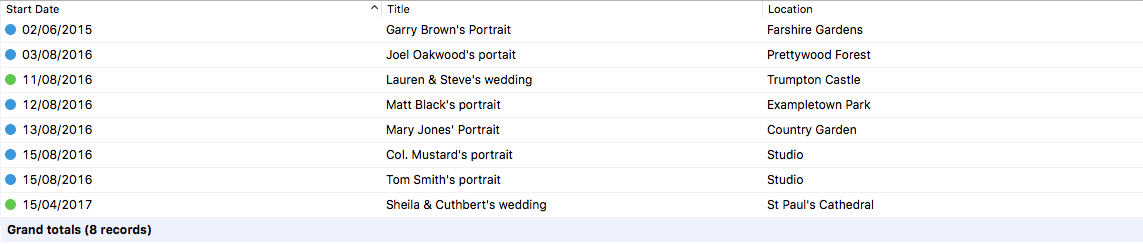
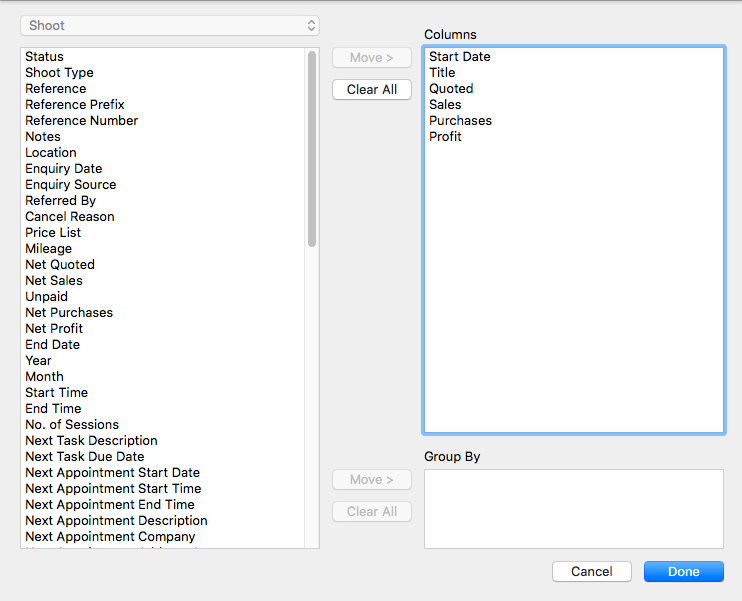
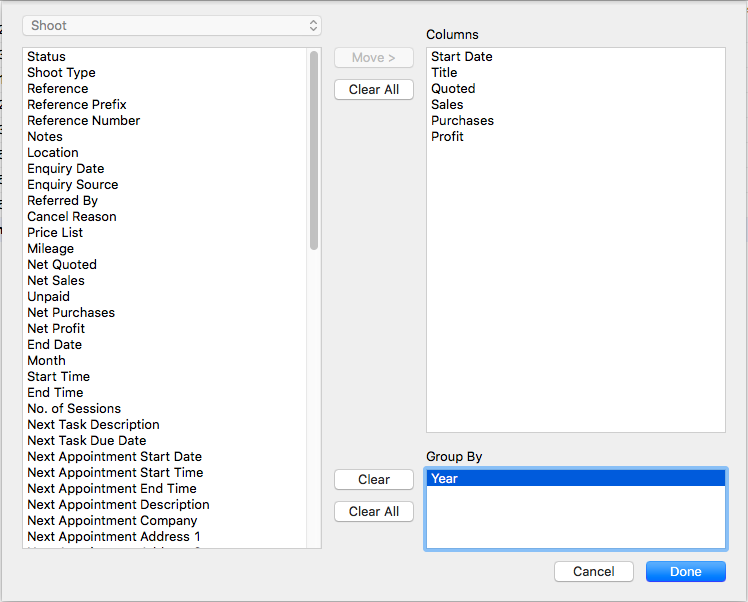
When you go into List View, Light Blue will show you a default set of columns, but you can choose to customise this to display the fields that are relevant to you.
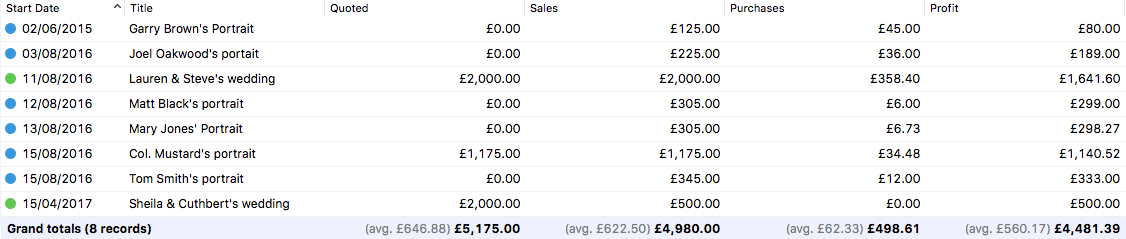
For example, you may be interested to see how profitable all your shoots from the previous month were. Having queried for those records, you can now customise the list view (by clicking Window > Customise List View) to show columns of the most relevant information.
Grouping records together
In List View, you can view the found records as one big list, or you can group them to give you a more helpful view of your data.
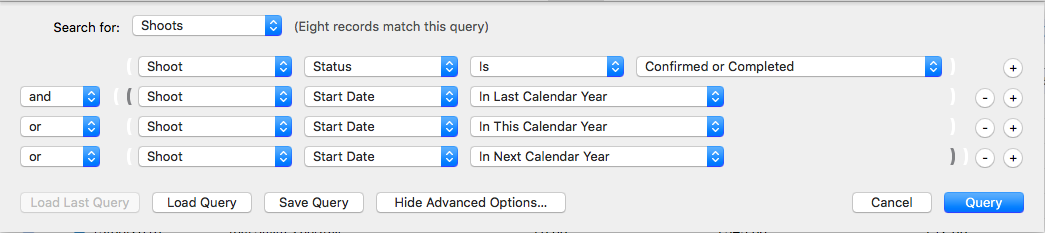
For example, it’s really useful to get an idea of how your bookings are doing year on year, so running a query for all of your confirmed or completed shoots in last year, this year and next year is a good starting point.
While you can sort all of these records by their start date, it can be pretty hard to see where one year ends and another begins, and without totals you’d need to count them up in your head.
Grouping the list view by year means that there’s a clear separation between shoots from one year and another.
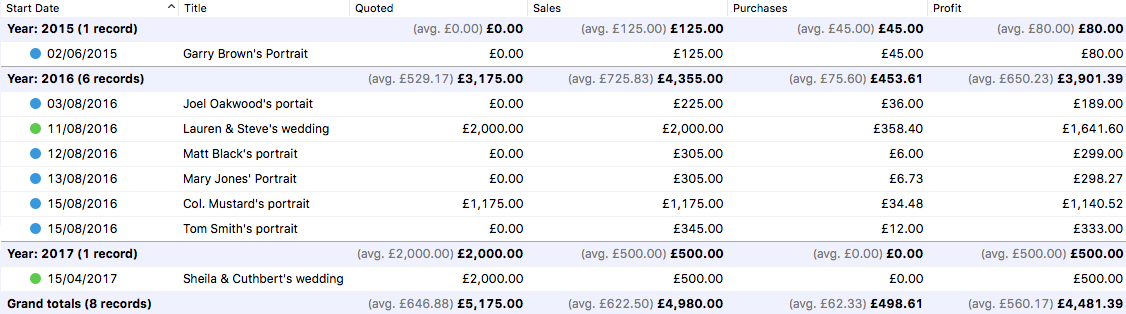
You’ll notice that we’ve now got sub-totals and averages for each group, essentially a list within a list. At a glance we can now easily compare how one year has performed against another.
Grouping records together isn’t limited to just one criteria, either. If you wanted to group your shoots first by year and then by enquiry source, that gives a useful picture of how many shoots you’ve booked for each year and also which types of marketing are proving most effective.
Saving custom reports
There’ll be some cases where you want to run a one-off analysis like this, but plenty of other cases where you might want to keep an eye on a particular set of figures regularly.
Light Blue allows you to save a query and the customised list view as a custom report, so it’s ready with a couple of clicks. It’s a huge time-saver for anyone who’s interested in getting the most out of their data.
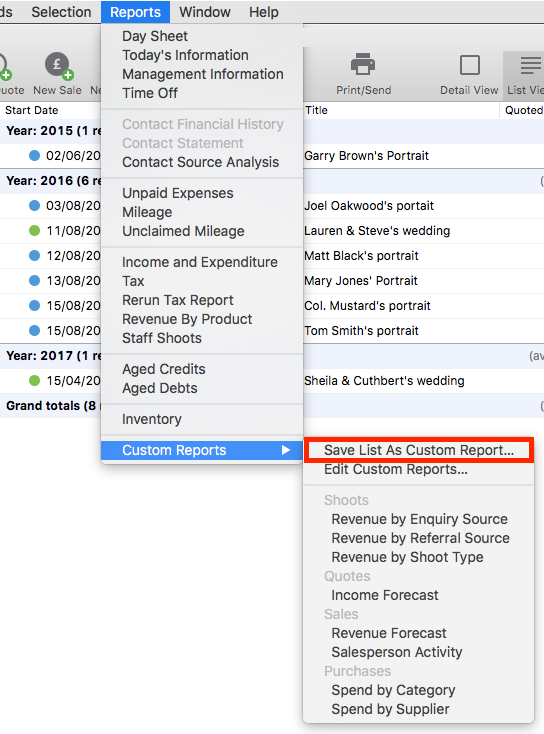
Whenever you want to re-run your report, you’ll find it in the Custom Reports submenu of the Reports menu.
Doing even more with your Light Blue data…
There’s even more that you can do to make the most out of the valuable data in Light Blue, and in the next article we’ll have a look at exporting information from Light Blue for use with third-party tools.
Using the Quick Queries to find useful information in Light Blue
Using the Query dialog to dig deep into your data
Exporting Data from Light Blue for use with third-party tools
Related
- 7 tips for more successful in-person sales (IPS) sessions
- Light Blue 2026.1.1 release notes
- Light Blue 2026.1 is here!
- Light Blue 2026.1 release notes
- Light Blue 2026.1 prerelease testing
- Light Blue 2025.1.4 release notes
- Light Blue 2025.1.3 release notes
- Light Blue 2025.1.2 release notes
- Light Blue 2025.1.1 release notes
- Light Blue 2025.1