Search for answers or browse our knowledge base.
Can't find the answer you need here? Contact our support team and we'll gladly help you.
🎥 Light Blue Charts
There are many ways to view and analyse your data within Light Blue; there’s the inbuilt Reports, the powerful Query feature including Quick Queries and using the List View to analyse Records in multiple ways for even deeper insights.
And last but by no means least there’s the powerful inbuilt Chart feature. To understand the different Charts available watch the video below; though if you prefer to learn by words and pictures, have a read of the help article instead!
Navigating the Chart section
Charts are one of Light Blue’s main sections visible down the right-hand side of the desktop app.
Once in the Chart section, there are various drop-down menus and a checkbox across the top allowing you to customise what you see and how it’s presented.
From left to right you can tailor the Chart:
- Information; your finances, enquiries and bookings are all covered.
- Style; do you prefer a line or bar chart.
- Timeframe: various yearly time frames are available.
- Comparison; do you want to include a comparison against previous year/s figures or not.
- Cumulative Totals: check the box if you want to see these rather than individual months.
And then at the bottom, you have clickable buttons to:
- “Open in List View”; all the Records included in the Chart will be displayed in List View allowing you to drill into the detail.
- “Export Data”; a CSV file of the Chart information will be created meaning you can carry out further analysis of your numbers.
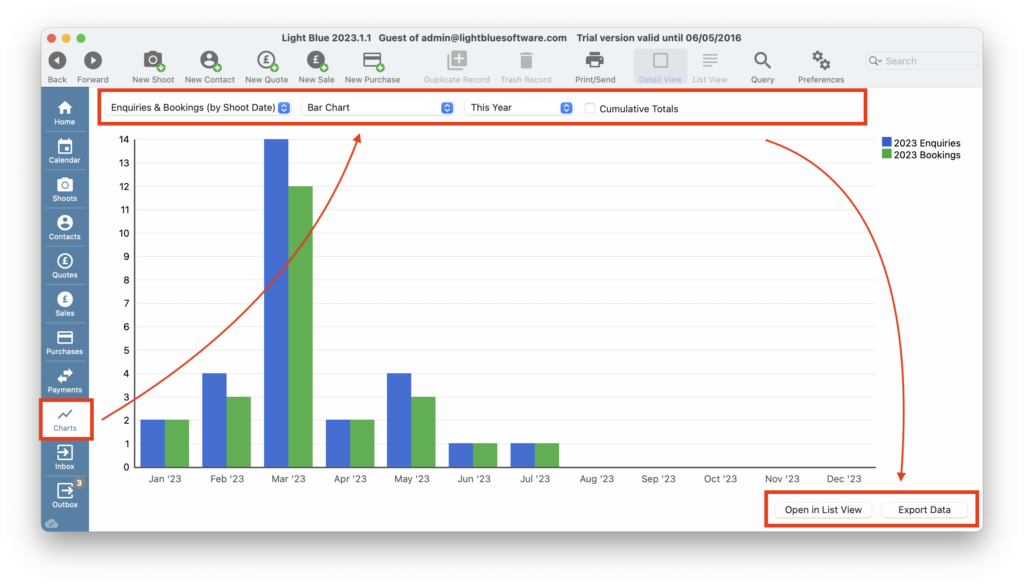
Chart Information
A variety of different information can be displayed in your Chart; simply choose the one you want to review from the drop-down menu:
- Financials; income, expenditure and profit alongside incoming and outgoing payments.
- Enquires; by Enquiry and Shoot date.
- Bookings by Enquiry, Confirmed and Shoot date.
- Enquires & Bookings; by Enquiry date.
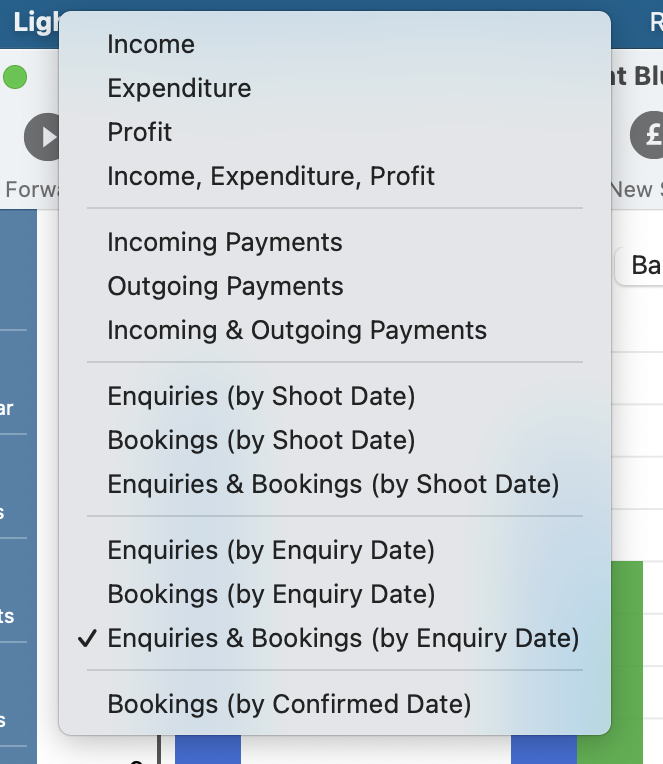
Chart Style
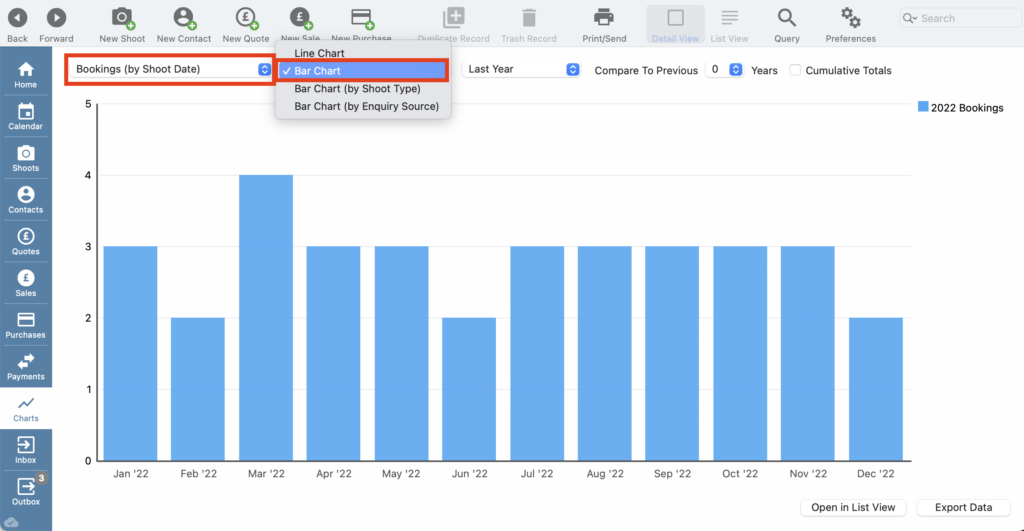
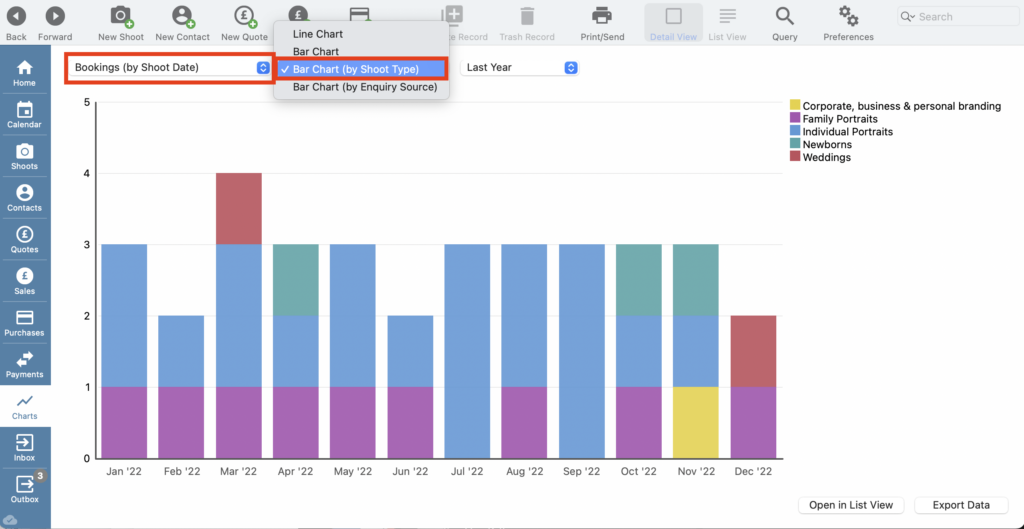
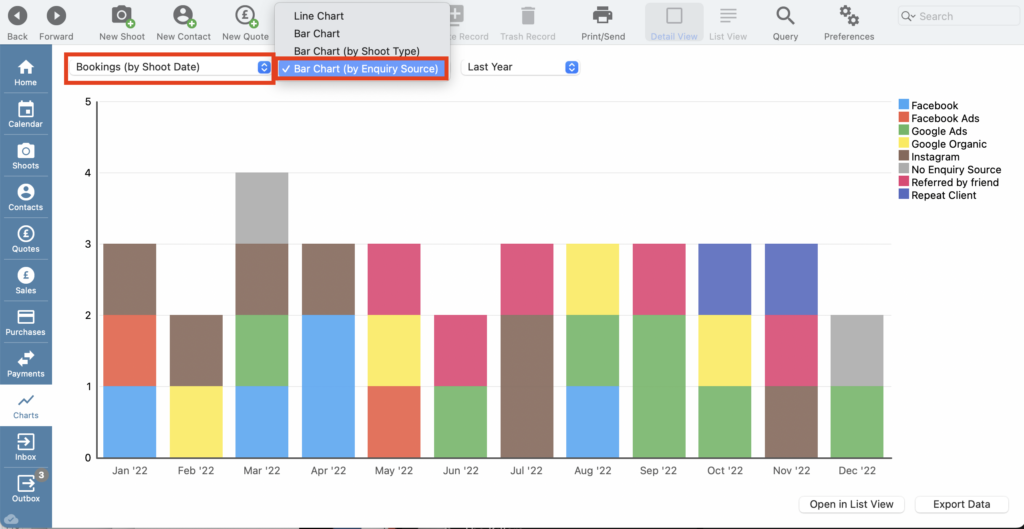
Depending on your preference you can choose either a Bar or Line Chart to view your data; again just choose which one you’d like from the drop-down menu, Some charts also give you the option to break down the information into another layer of detail.
In the screenshots below you can see the information, ’Bookings (by Shoot Date)’, displayed four ways; as a Line Chart, Bar Chart, Bar Chart (by Shoot Type) and Bar Chart (by Enquiry Source). This granular detail allows you to view how the different areas of your business are performing against each other and how effective your different marketing strategies are.
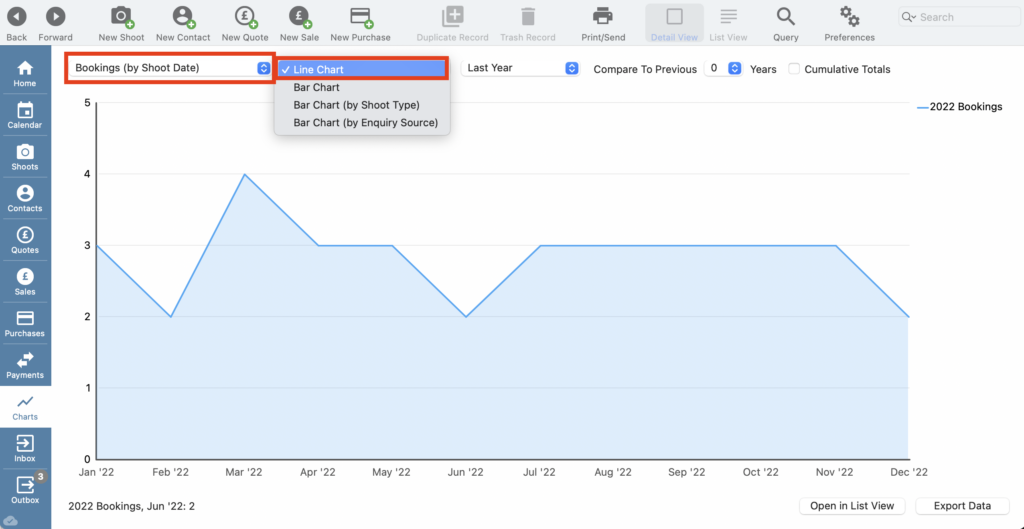
NB. In Line Charts, when you hover over a data point the actual value will display in the bottom left-hand side of the chart.
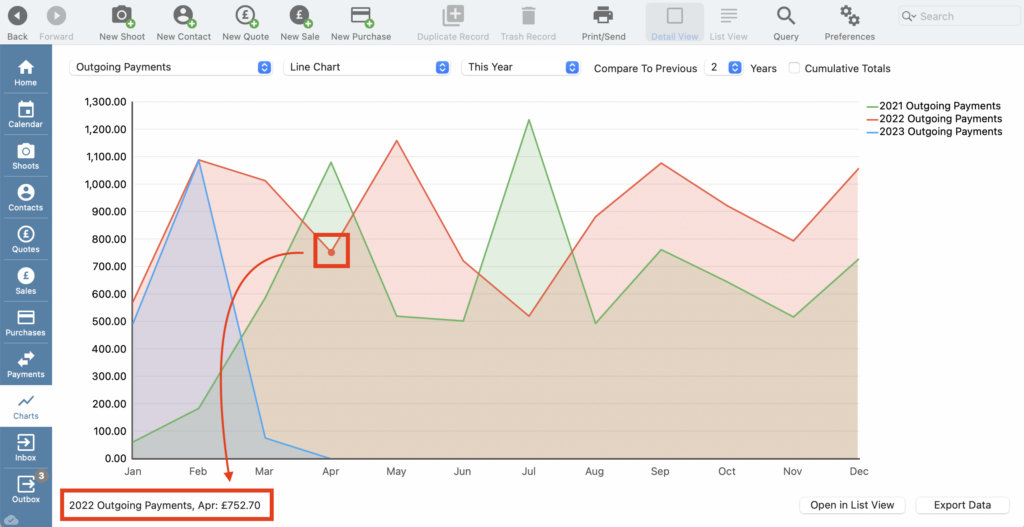
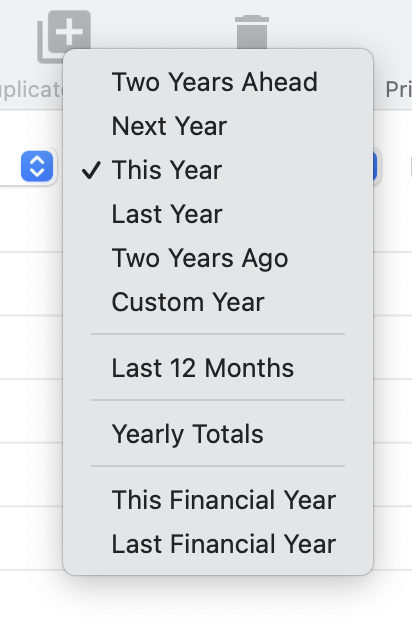
Chart Timeframe
You can choose from a variety of yearly timeframes from the drop-down menu and with Enquiry and Booking information you also have the option to look forward to next year or two years ahead.
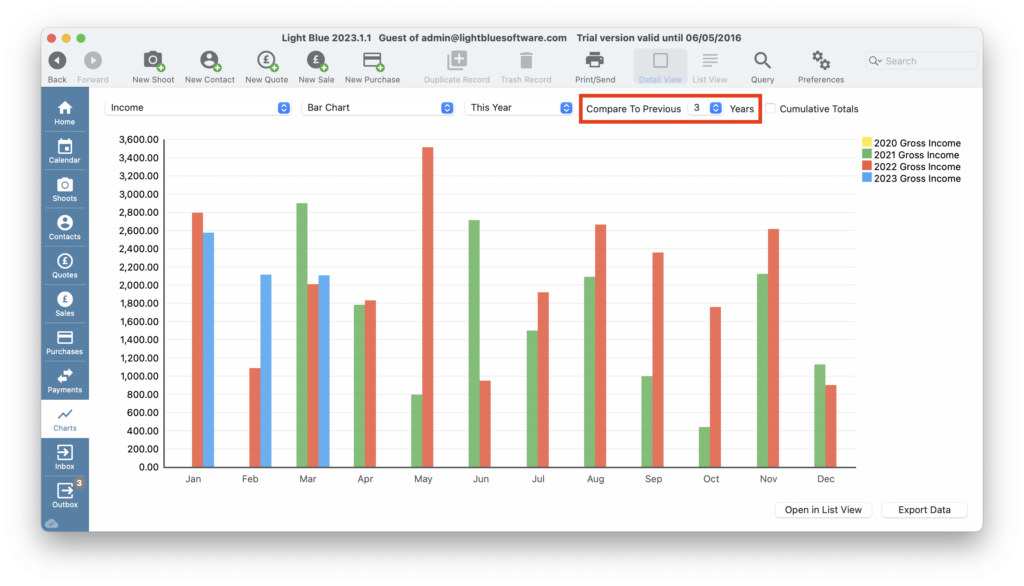
Comparison against previous year/s
Certain Charts give you the option of being able to compare your numbers against previous years which is handy for spotting any trends or anomalies in your business; for example, are specific months looking better or worse than you’d expect. And you can see as many as 10 years in a chart; simply choose how many from the drop-down menu. NB. You can only view a single year with the (By Shoot Type) and (By Enquiry Source) Bar Charts.
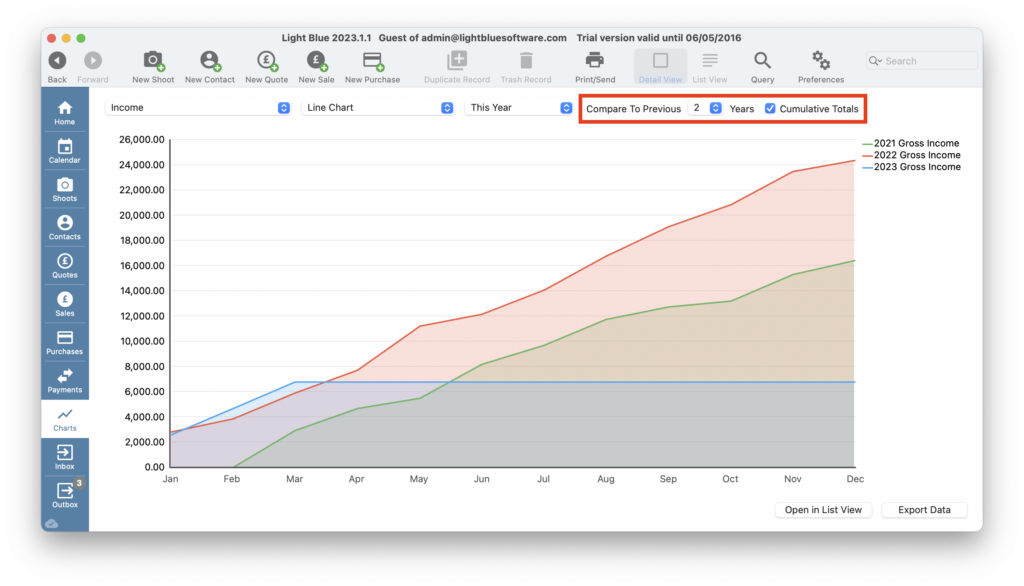
Cumulative Totals
Checking the “Cumulative Totals” box is handy to view how your total numbers progress month on month across a particular year. You can also compare to previous years to get a thorough understanding of how the current year is shaping up. NB. You can only view individual month figures with the (By Shoot Type) and (By Enquiry Source) Bar Charts.
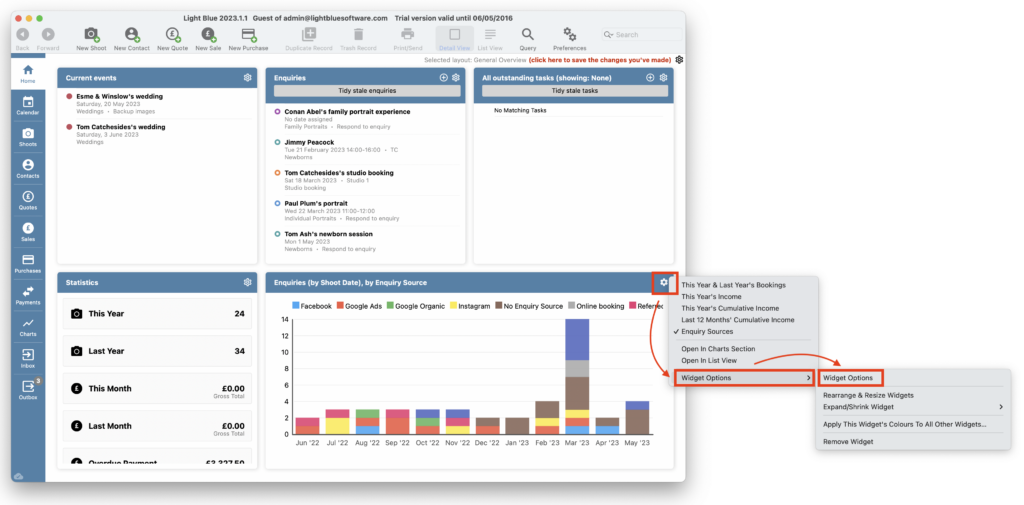
Adding Charts to the Home Screen
You can easily add any of the Charts (or several!) to your Home Screen using the Charts Widget. A few useful Charts have already been created, along with shortcuts to open the same Chart in the Charts section or in List View. Though of course, you can add any of your own favourite Charts through “Widget Options”.
👉 If you want to know more about customising your Home Screen head on over to this help article.