Search for answers or browse our knowledge base.
Can't find the answer you need here? Contact our support team and we'll gladly help you.
Analysing Records using the List View
There are many ways to view and analyse your data within Light Blue; not only are there inbuilt Charts and Reports, there’s also the powerful Query feature including Quick Queries, However one deceptively simple way to delve deeper into the analysis is to use the List View on a set of Records.
In this help article we’ll take you through all the different options available with List View; from viewing a simple list of Records all the way through to sorting and grouping a list of Records by multiple criteria and saving it as a Custom Report.
First things first though, we’ll give a brief explanation as to the difference between List View and the other viewing option in Light Blue; Detail View.
Detail View vs List View
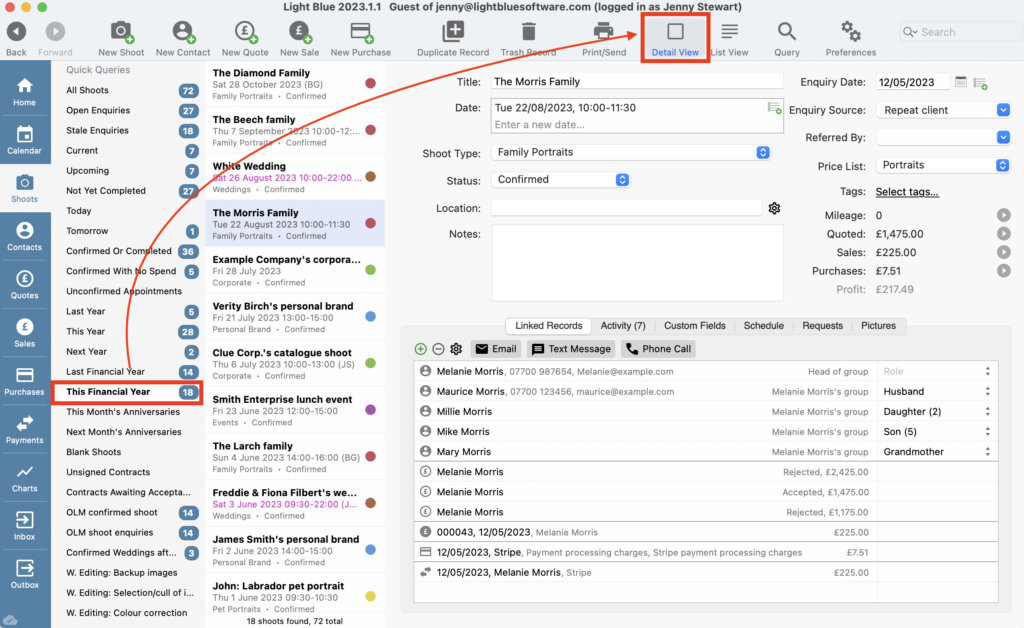
Whenever you’ve got a set of Records showing, either by clicking on one of the Quick Queries in each of Light Blue’s main sections or are viewing the results of a new Query, you have the choice as to whether you view the Records in Detail or List View.
Detail View shows the full set of Records with a brief description under each one and you simply click on any Record to view the full detail.
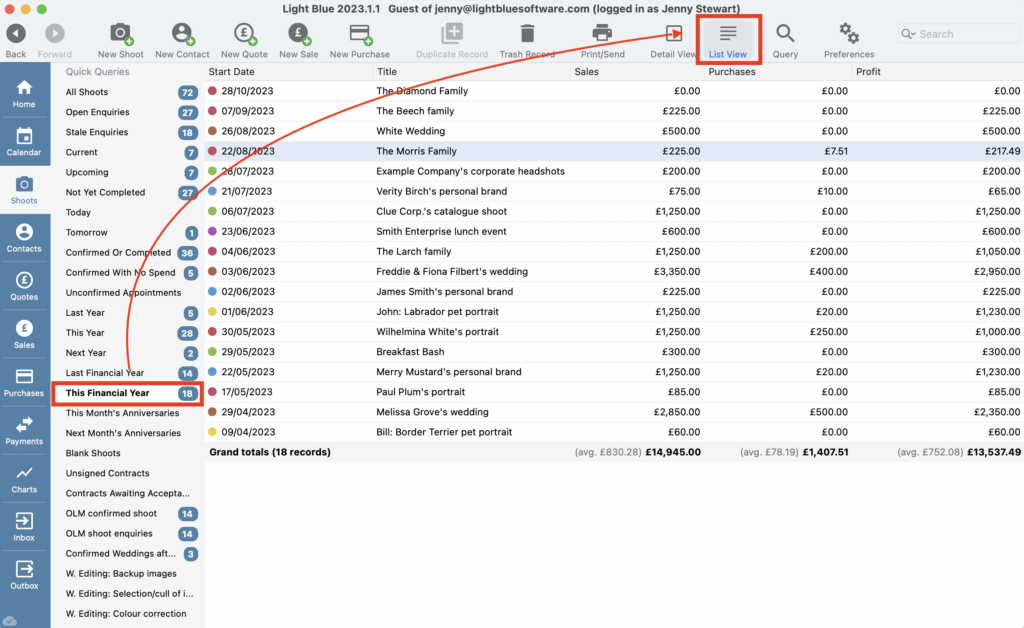
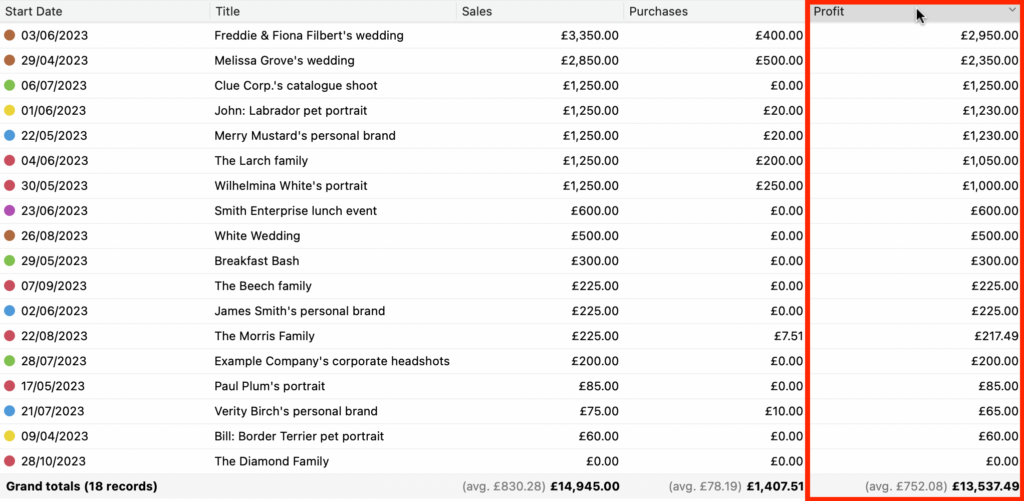
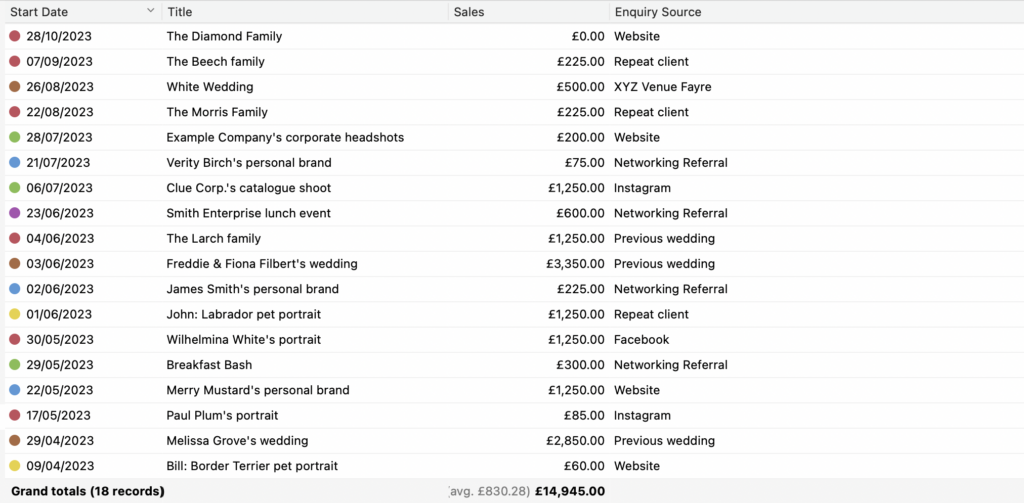
List View shows a list (surprise surprise!) of your chosen set of Records with different information fields from the Record showing in each of the columns including the total and average values. And whilst Light Blue comes pre-populated with a default set of columns, there are numerous ways you can customise them. This ability to pick and choose columns and to then sort and group the same data in multiple ways can give you a range of different insights as to what’s happening within your business; and best of all if it’s analysis you carry out regularly you save it as a Custom Report.
Simple List View
The first time you view a set of Records using List View a default set of columns will be shown which will vary depending on the type of Records you’re viewing. Along with now being able to see the total and average values these columns could well be sufficient and give you all the information you need; you may simply want to reorder the information or resize the columns.
To reorder the information, click on the column header and it will reorder in descending/ascending order.
To resize the columns click and slide the slider in the column header like you would in any other table.

Customising the List View
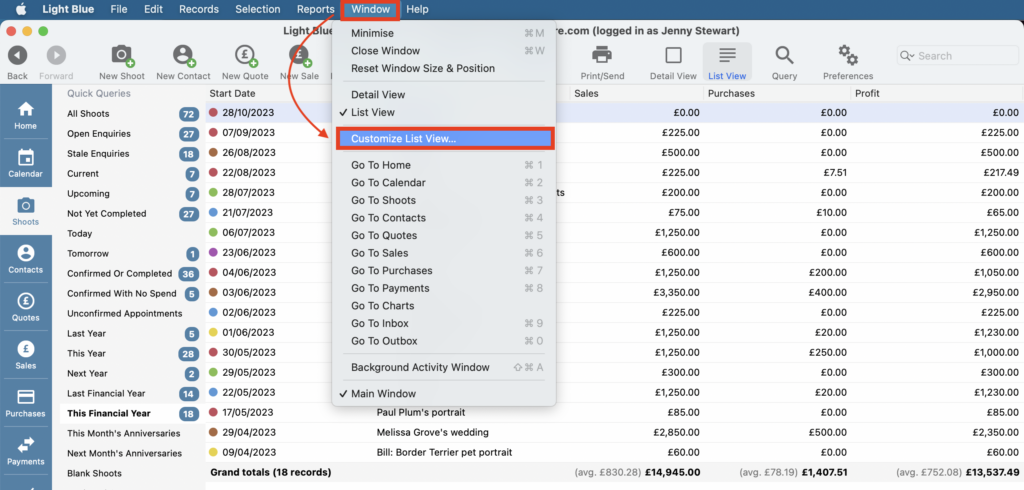
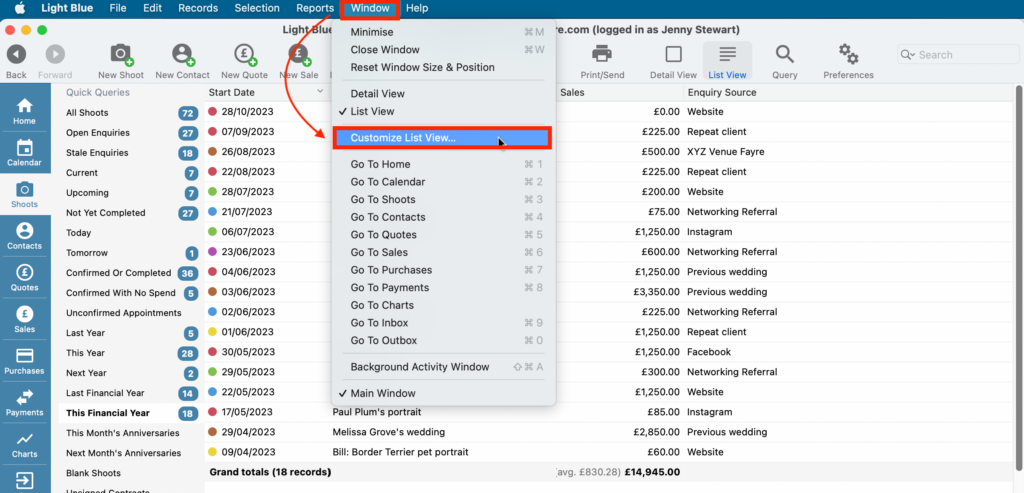
If the information presented isn’t exactly what you’re most interested in reviewing it’s very straightforward to add or remove columns. In the example below we’re adding the Enquiry Source column and removing the Purchases and Profit columns; simply click on “Window” in the main menu bar and choose “Customise List View…” from the drop-down menu.
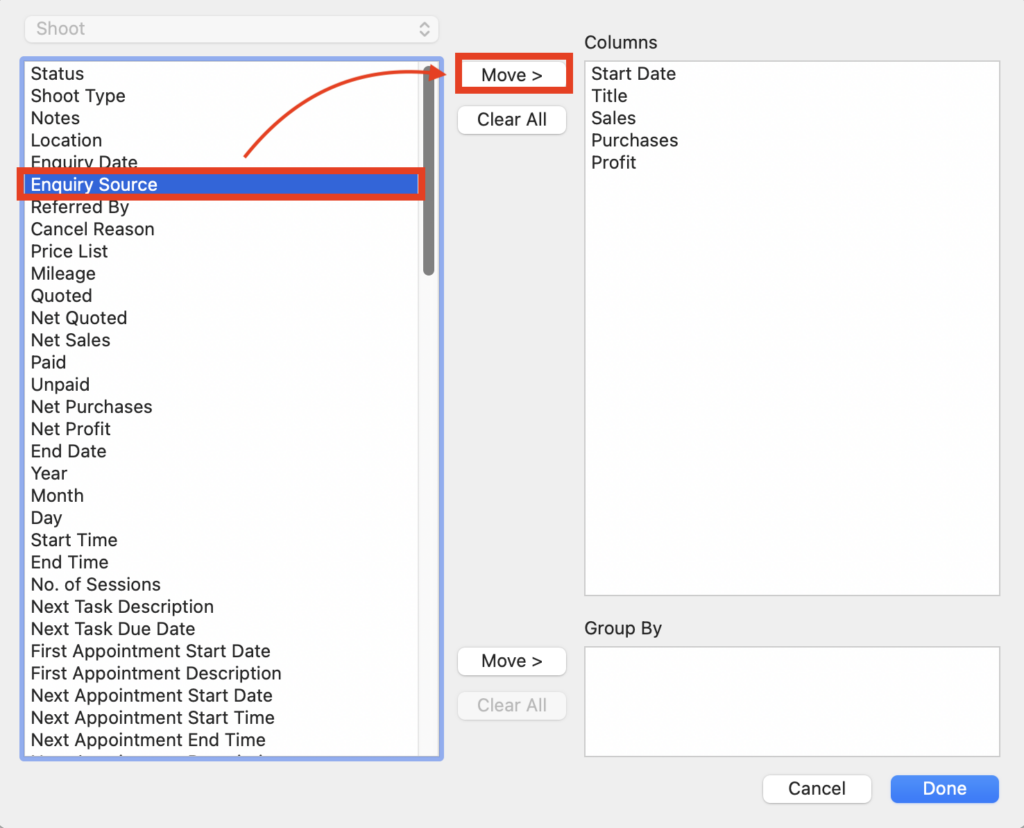
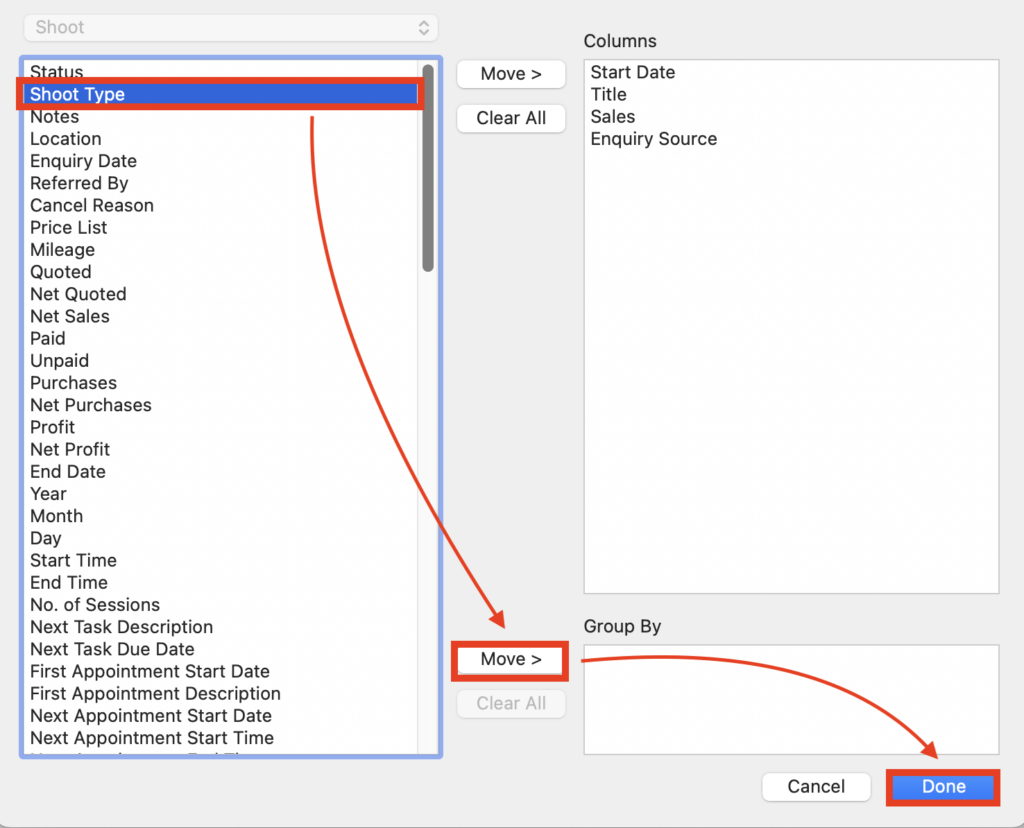
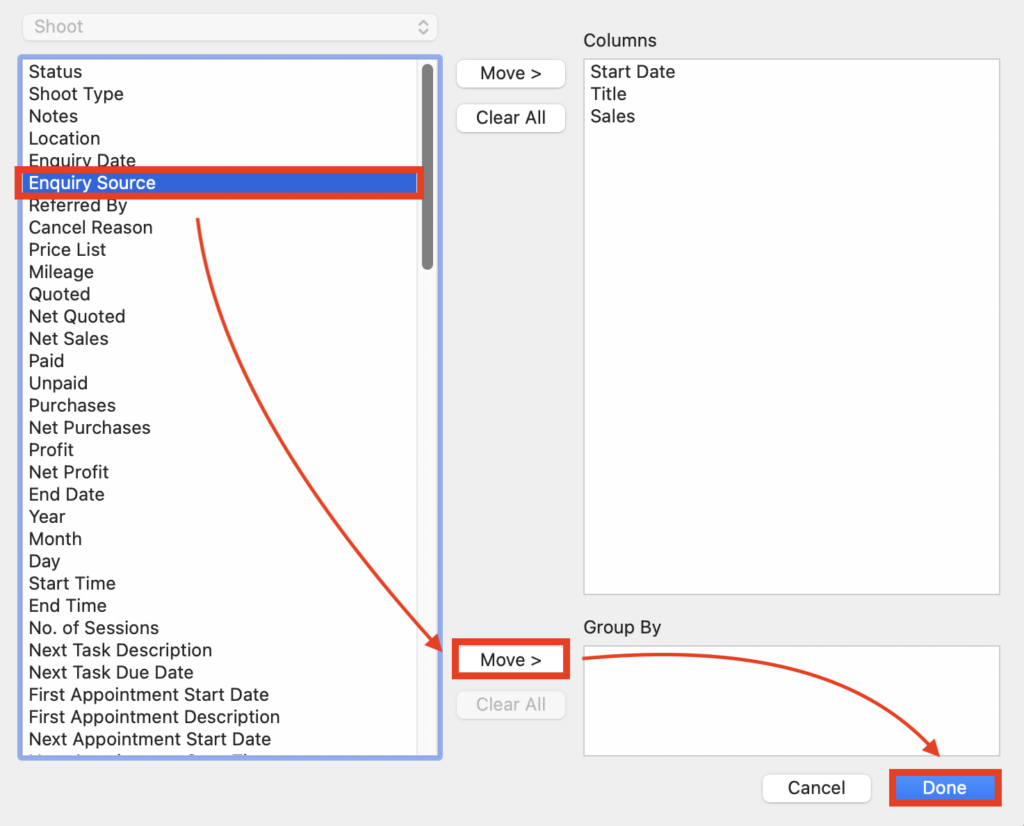
To add a column, in the left hand pane click on the information field you want to add and click the top “Move >” button to add it to the Column pane.
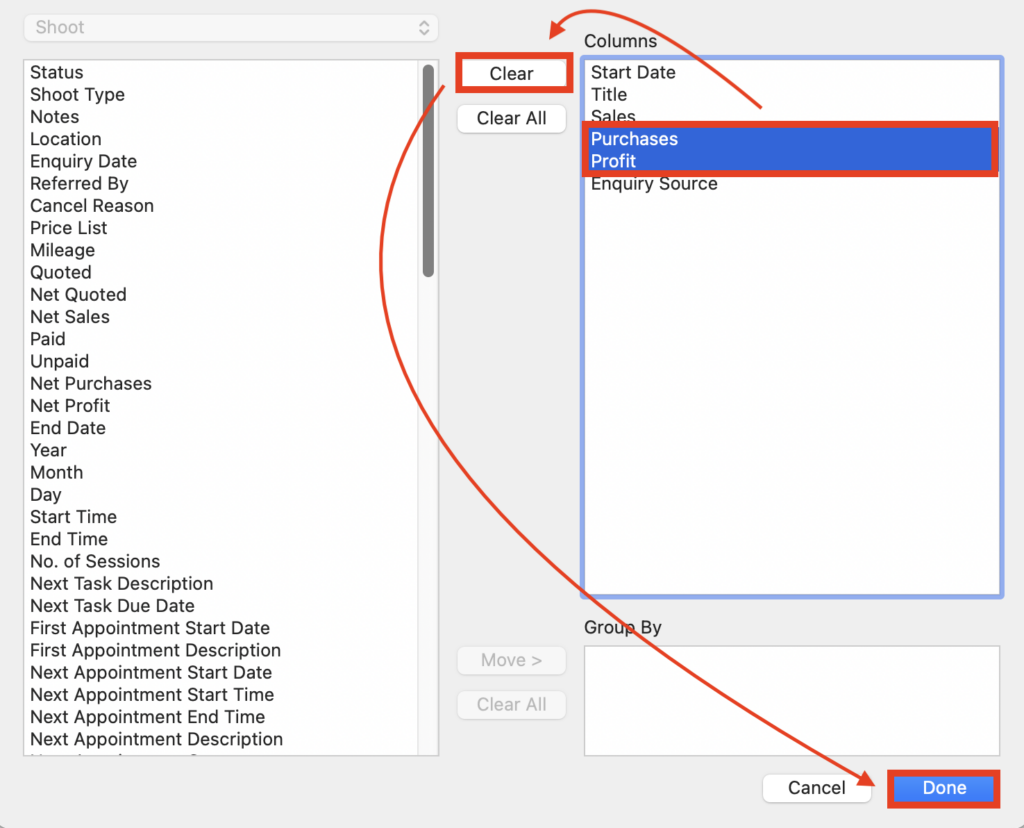
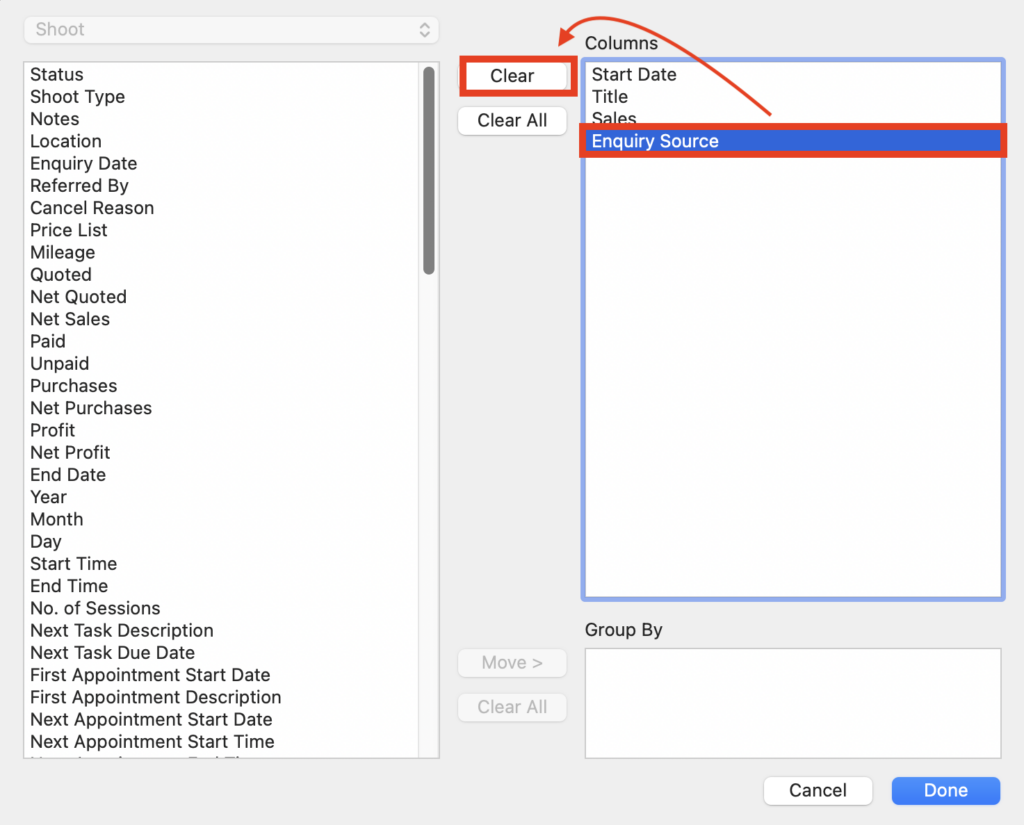
To remove a column, in the Column pane click on ones you want to remove and click the “Clear” button. When you’re finished click “Done” and your updated columns will be showing in List View.
Grouping Records in the List View
If you find yourself with a long list of Records it can be hard to get deeper insights so being able to group the Records allows you to analyse the information in more detail; and as the subtotal value and averages for each group are displayed it becomes easier to see where your business is performing best, or not! You can group your Records using one or multiple criteria depending on the depth of analysis you want to carry out.
Grouping by one criteria
Using the same data in our example we’d like to group our Records by Shoot Type; click on “Window” in the main menu bar and choose “Customise List View…” from the drop-down menu.
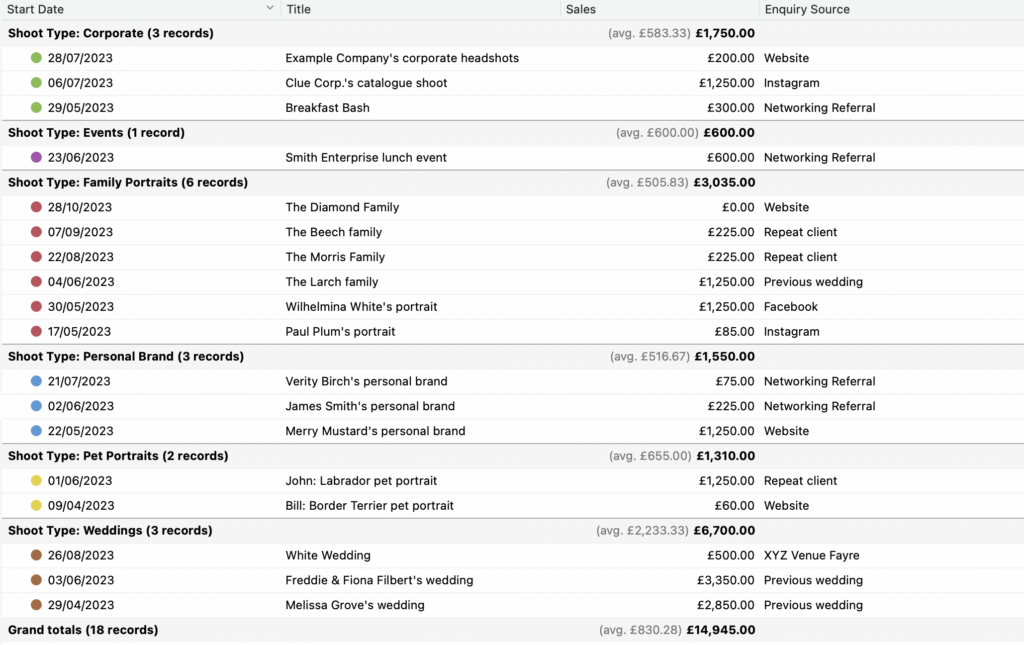
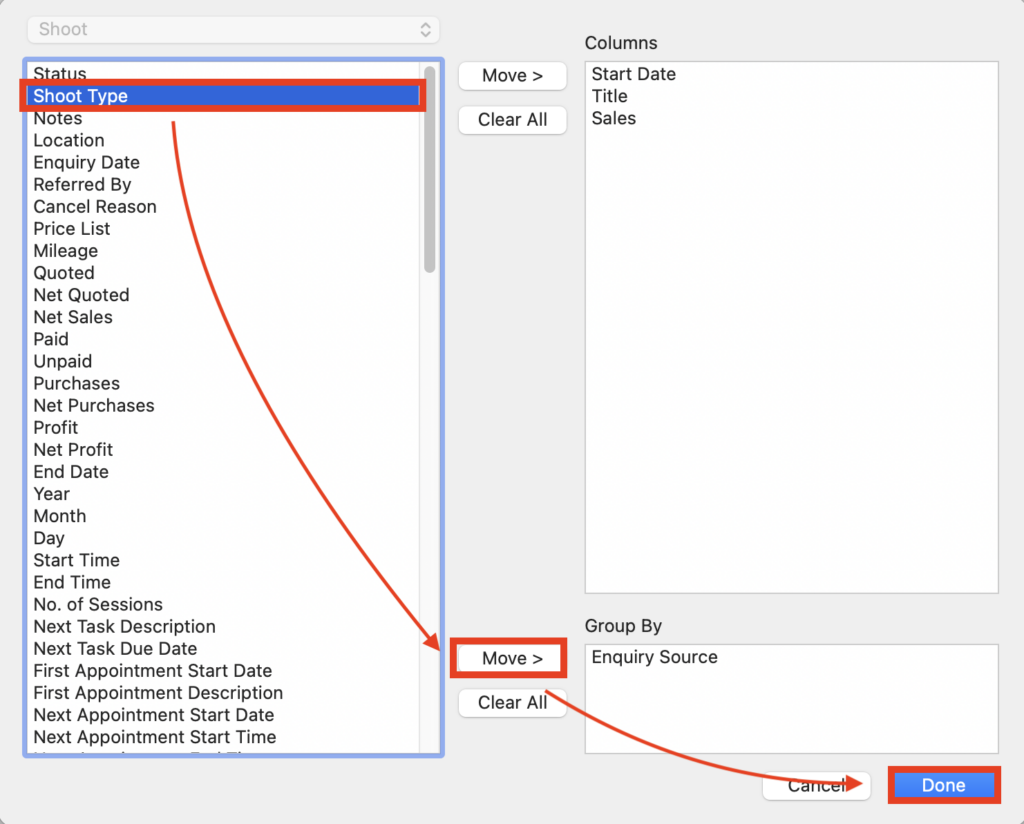
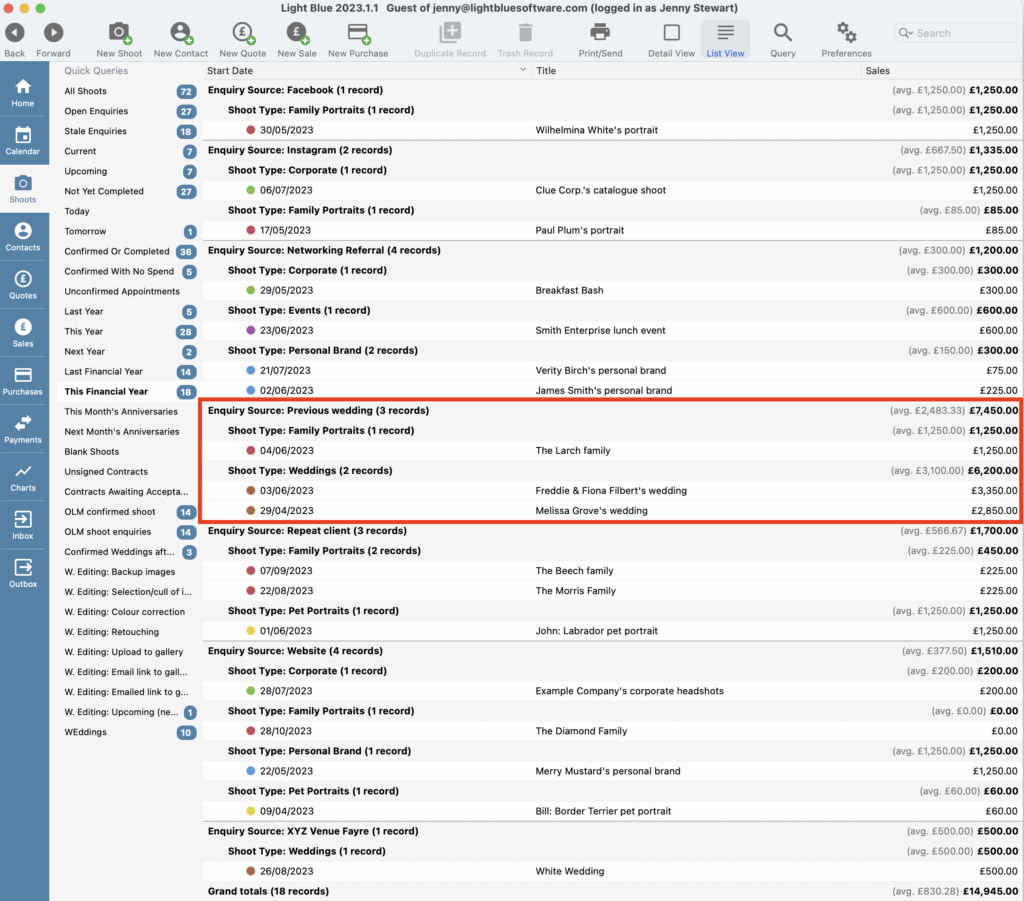
In the left hand pane choose the information field you’d like to group your Records by and click the bottom “Move >” button to move it to the Group By pane. Then click “Done” and your grouped Records will be showing in List View. We can see in our example that whilst we’ve had more Family Portrait sessions this financial year our Weddings have generated the most income. And surprisingly (well maybe not if you’re a pet lover) our Pet Portraits have a higher average Sales than our Family Portraits.
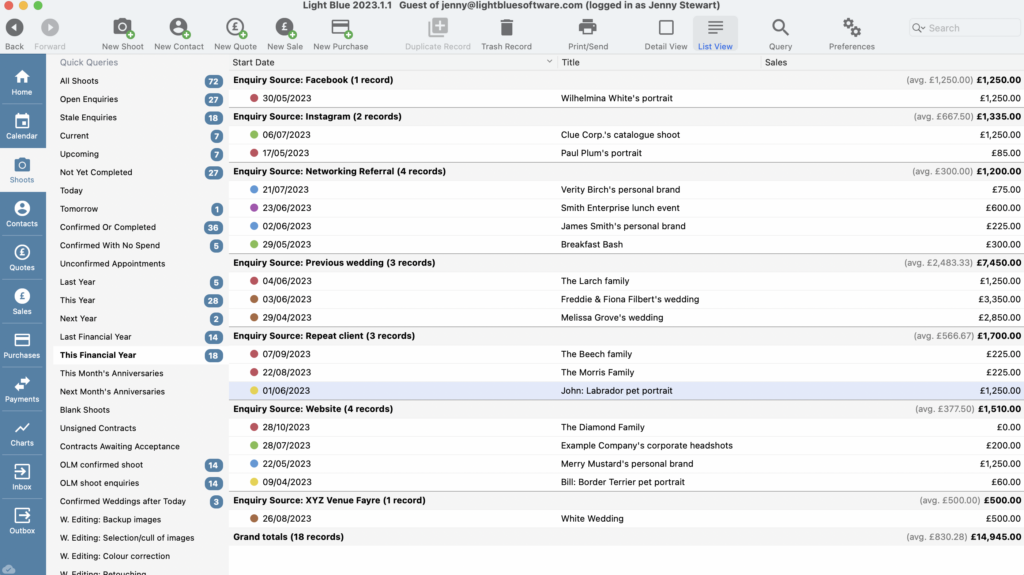
NB. If you want to group your Records by an information field that is already in the Column pane you will need to clear it from there and then move it into the Group By pane. In our example we can now see from the same list of Records that previous weddings have been our most valuable Enquiry Source.
Grouping by multiple criteria
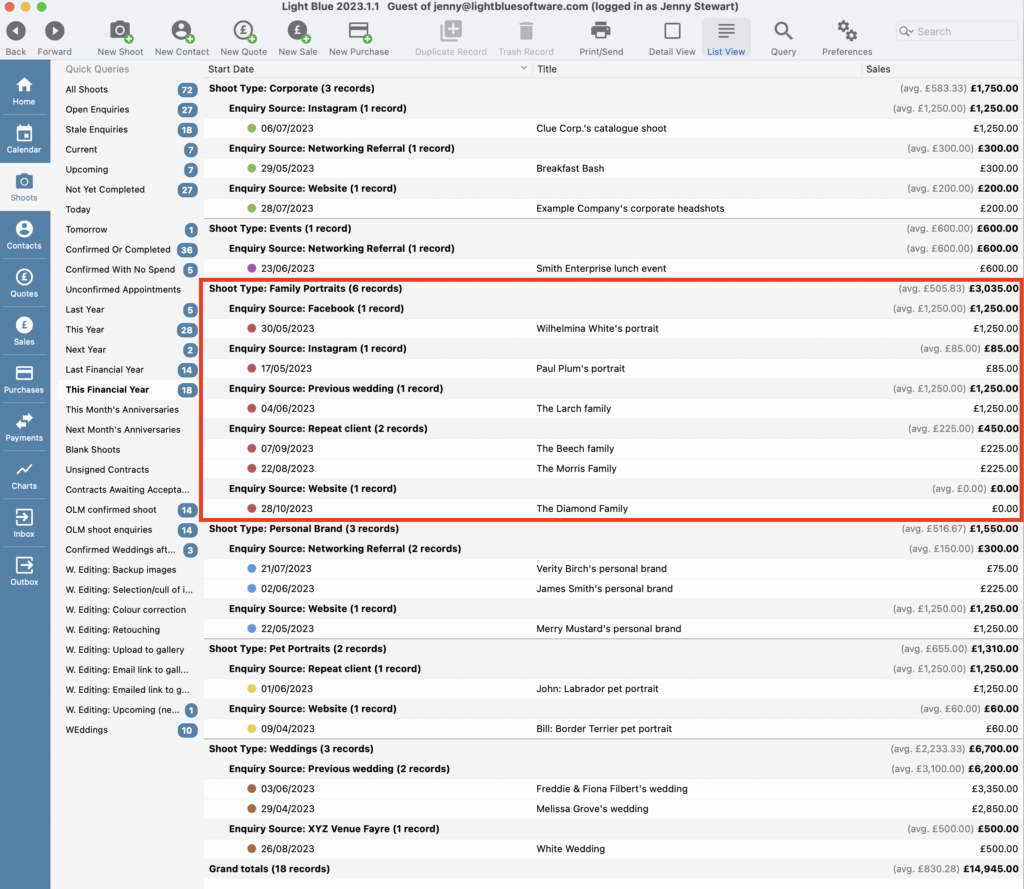
Using multiple criteria to group your Records can be handy to drill even deeper into the data. Simply choose the extra information field you’d like to add to the “Group By” pane, click the bottom “Move >” button followed by “Done” and your revised grouping will now be showing in the List View. Using the same data we can now see that we’ve had a Family Portrait booking as well as Weddings from our previous weddings Enquiry Source.
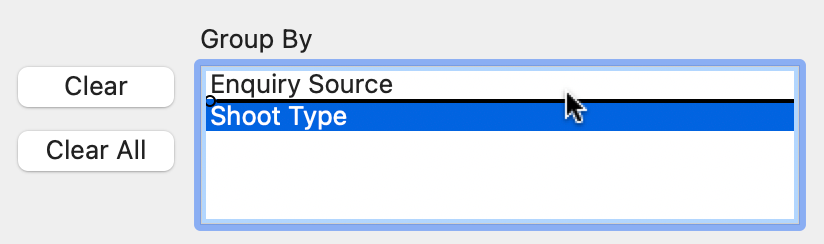
And if you want to change the order of the grouping to give a different insight, simply click and drag the relevant information field in the Group By pane. Now we can see that with our Family Portraits there isn’t a prominent Enquiry Source!
Custom Reports
Whilst you may run several one-off pieces of analysis in your business there’s likely to be a particular set and format of information and figures that you review regularly. And the great news is that Light Blue allows you to save this as a Custom Report allowing you to easily review the information time and time again with the latest set of data.
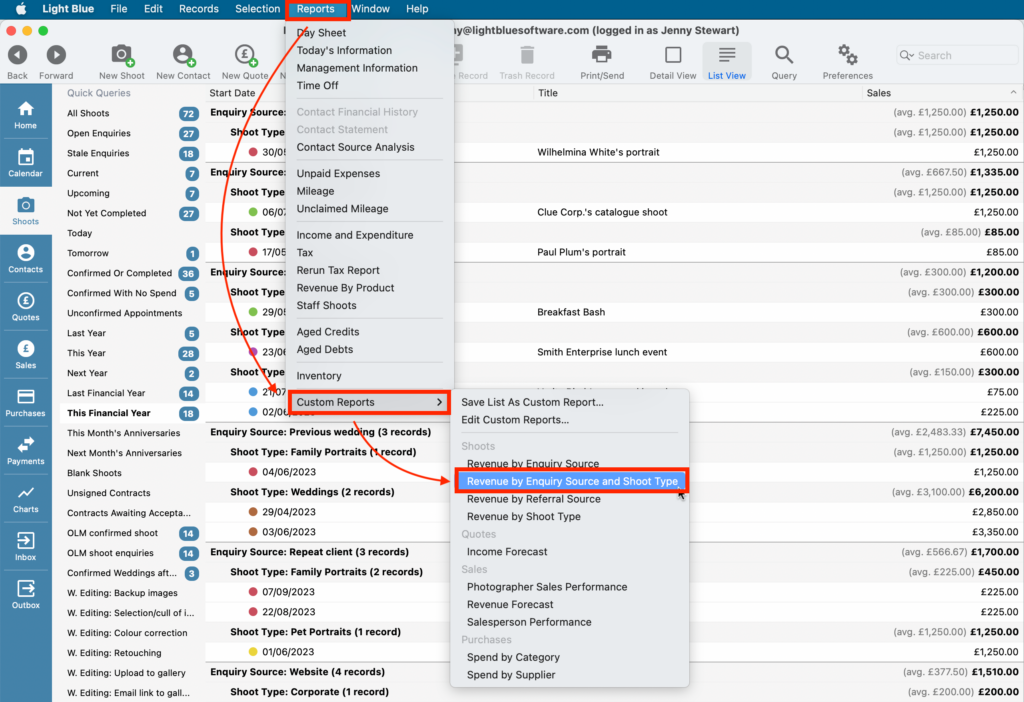
Make sure you save your Query and when you have customised List View as required, click on “Reports” in the main menu bar and choose “Custom Reports”, followed by “Save List As Custom Report…” from the drop-down menus.
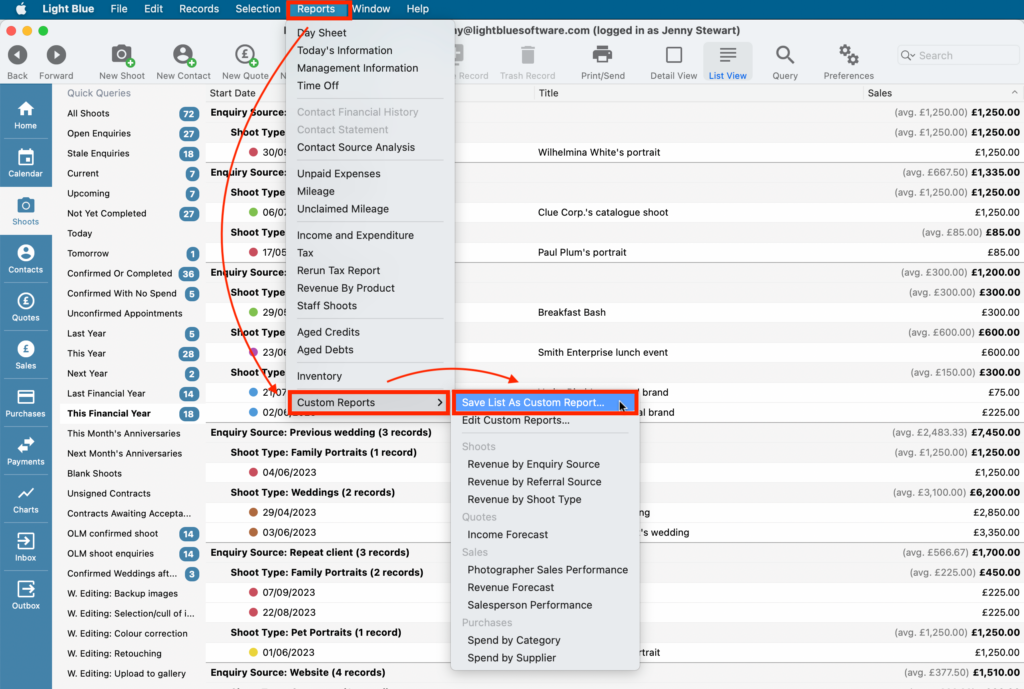
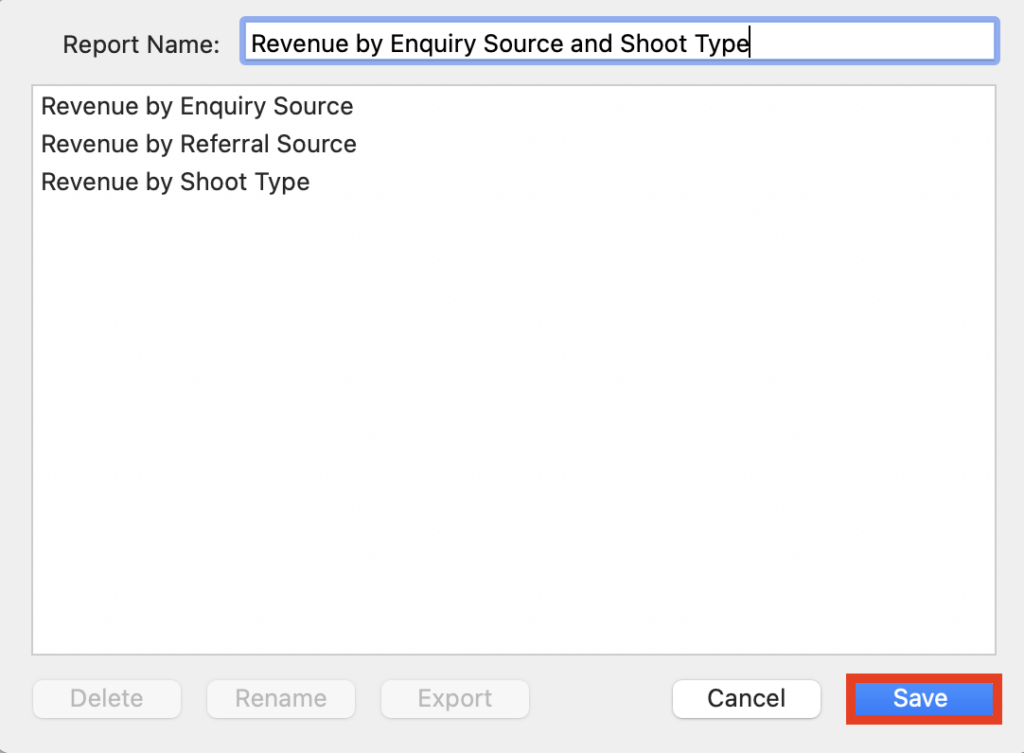
Give your report a name and click Save; this will save the combination of the Query and List view. Then when you want to review it in the future click on “Reports” in the main menu bar and choose “Custom Reports”, followed by the report name from the drop-down menus.